

Semiconductor supply chain on the edge?
The Q2-2026 semiconductor earnings rush is long gone, and even the laggards have now reported in their first Q3-2026 earnings calls. It is time to get a grip on what is going on in the semiconductor industry and its supply chain.
The Q2-2026 semiconductor earnings rush is long gone, and even the laggards have now reported in their first Q3-2026 earnings calls. It is time to get a grip on what is going on in the semiconductor industry and its supply chain.
The headlines are already clear, and most experts have formed their opinion in line with the dug-in convictions and what benefits their wallets. They are focused on the next quarter and have already made up their minds about that too.
An expert mindset is one that knows better, and it is never surprised. “I saw that coming” and “I told you so” tell you what you are dealing with.
An analyst's mindset is different. Even if the situation is obvious, there is still a lot to learn from analysis, but most semiconductor stakeholders do not have time for that. They have a business to run, and all that business analysis doesn't make a difference.
And most of the time, they are probably right. They have, however, all been in situations they would have done anything to avoid. Placed too few orders at a given time and too many at another. Mistiming the semiconductor cycle is expensive, both up and down and believing trickle-down economics is always a valid theory in the supply chain can be devastating.
Hired, fired and rehired in the same cycle. The problem is that all of these events are easy to understand in hindsight and even easier to categorise as black swan events.
This absolves management of any blame for mismanagement, but black swans are rare. I am not an expert in swans, but my analysis on my daily walk by the sound that is the winter quarter for thousands of swans has yet to produce one.
There are, however, plenty of grey swans. The ugly ducklings are all young, and most of them turn white, but you never know. This is where business analysis becomes valuable.
We all know that this has been the memory quarter. Prices have continued to explode, and memory companies have more money than they know what to do with. The most popular profile picture on Tinder in Korea is a geek in a worn SK Hynix T-shirt. A Samsung T-shirt is riskier, as it could be a poor soul from the mobile division.
But knowing what is going on is not the same as understanding it. If you ask your favourite LLM what is going on, you get a large portion of word salad with no protein. This is all more hay on the insight needles and does not get you nearer to understanding the situation.
If you torture the LLM some more, you will find that it has plenty of knowledge but little understanding. It has difficulty connecting the dots to form a high-level view.
Although LLMs are certainly getting better, I still believe I have a job to do in analysing the Semiconductor supply chain, but I will let you be the judge of that.
This analysis should be seen in light of the current global context of an increased potential for socio-economic shocks. In what might sound counterintuitive, the Trump administration’s tariff policies have done a lot to harden the semiconductor supply chain, improving its robustness amid unpredictability.
We are, however, facing a potential shock from the US attack on Iran. The most obvious one is an oil shock due to the latest developments like the strike on Saudi pipelines, the Hormuz Strait closure and the Houthis’ advancements towards the Bab al-Mandab Strait.
Semiconductor Market Revenue Q2-2026
The quarter was unprecedented, but that is not unprecedented any more. The market is once again in rapid, uncontrolled transformation, and the ripples will be felt throughout the supply chain.
The quarter added another USD 100B to the semiconductor market revenue, the same as the entire market just 6 years ago. The QoQ growth rate was 31%, or 800 basis points higher than the revenue growth over the entire last semiconductor cycle.
If there still is a “semiconductor cycle” and it ends now (as it would under normal circumstances), the cycle's growth would have been 3x, or a 31% CAGR, since the last peak.
The current quarter represents a significant acceleration from the average cycle growth so far.
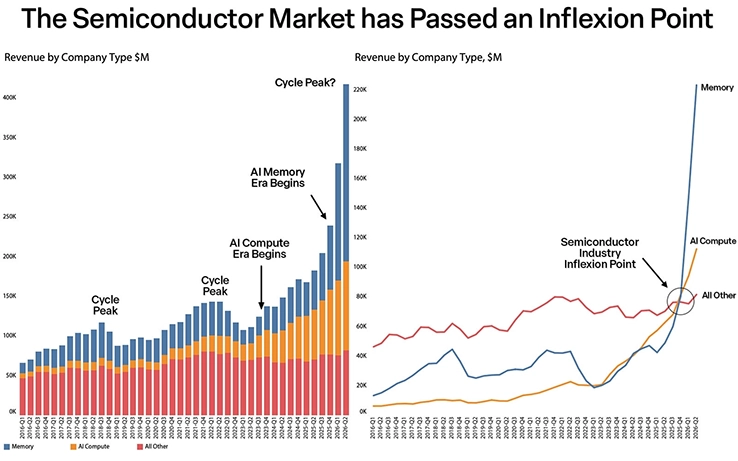
We are now a couple of quarters past the inflexion point where the Semiconductor market was evenly divided among AI Compute, Memory, and all other semiconductors and the AI memory era is in full bloom. Of the USD 100B growth, USD 75B is in memory, and most of it has to come from the hyperscaler CapEx budget.
The CapEx of the five top hyperscalers grew by USD 33B to USD 181B in Q2-2026, so it is fair to assume that most of the 22% QoQ CapEx growth will not be used for additional capacity but rather to pay the memory tax for projects already in progress.
Seen in this light, it is probably not surprising that the large AI Labs have called for a slowdown in frontier AI model development. Their argument is that AI is becoming too good too fast (marketing or true?). What is certain is that a cooling in AI data centre spending will impact memory prices over time.
Close to half of the current memory capacity is now under long-term contracts with fixed capacity commitments, so a return to the 2022-23 memory crash is not plausible.
While the memory swan is not white, it is certainly not black either. After the scars of the last memory-sector depression, when the large memory companies operated at full capacity at negative gross margins, they have promised themselves never to let that happen again.
The move toward High Bandwidth Memories (HBM) was a shift away from commodity markets and toward a more sustainable business model, but the issue is that HBM sucks up a lot of capacity.
An HBM bit that initially required 2-3 times the capacity of a standard DRAM bit now requires 3-4 times as much, and this will only get worse as HBMs become denser and faster.
Standard DRAM capacity has been cannibalised to produce HBM, resulting in a decline in overall memory capacity.
At the same time, the memory companies were more than careful with their CapEx investments. Given the risk of sounding like an expert rather than an analyst, I pointed this out in a post in May 2024.
While I like to be right as much as anybody, this is beside the point. The point is that the signs were there, and the memory swan is not black as some experts suggest.
The Memory Era is now reshaping the composition of the entire industry, as shown below.
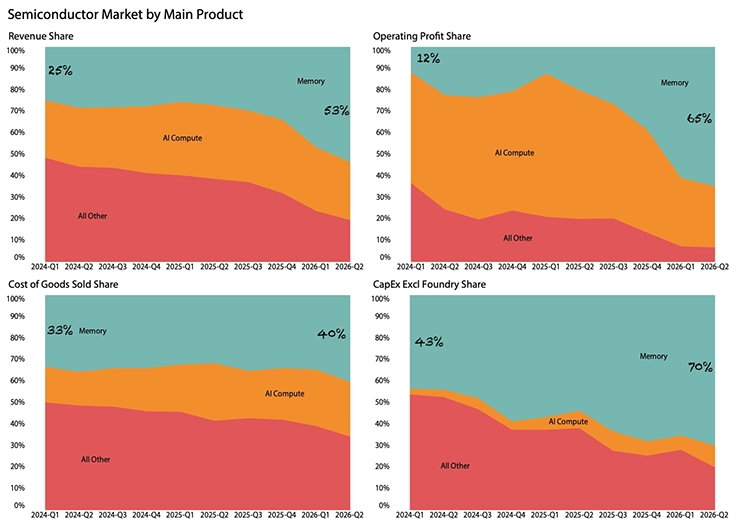
In just over two years, the memory share of the semiconductor market has risen from 25% to 53% in Q2 of 2026, and it will increase further in Q3 of 2026 even if the frontier labs take a break. The backlog is already in place.
This should be seen in light of the more modest growth in Cost of Goods Sold, which is a closer proxy to the actual share of production in the industry. The COGS growth over the same period has “only” increased by 700 basis points to 40% of the industry’s COGS.
With 40% of COGS, memory companies now account for 65% of the industry's operating profit, more than twice that of AI compute companies, including Nvidia.
A little over a year ago, in the AI compute era, AI compute companies commanded two-thirds of operating profits, and while operating profits have increased, this is not enough to offset the wealth redistribution to memory companies.
The remaining semiconductor companies account for less than 7% of total operating profits.
This transformation is radical, as evident in the headcount chart by company type below.
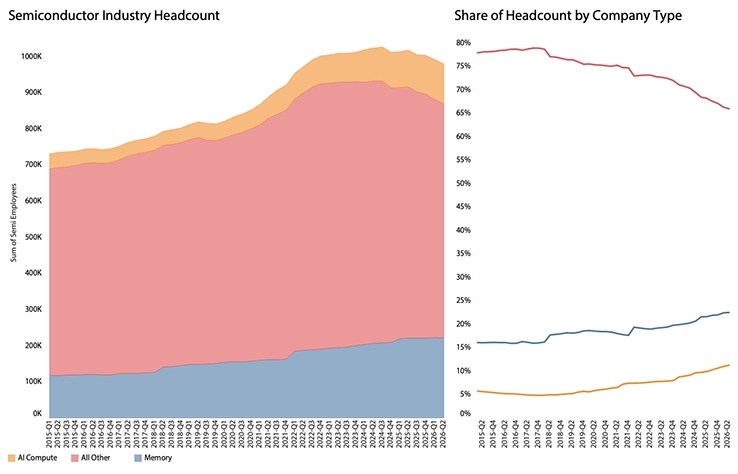
It is worth noting that AI compute companies generally have no production employees, while memory companies have internal manufacturing, and other companies have a mixed approach; this does not obscure the fact that two-thirds of my almost a million colleagues have to share less than 7% of the industry’s operating profits. This is a wealth distribution of epic proportions.
I did not forget to comment on the earlier CapEx chart, as it needs an additional chart to complete the analysis.
While the Memory CapEx is almost solely in their own hands, the two other groups have some or all of their silicon manufacturing outsourced to a foundry.
The Foundry CapEx is added below.
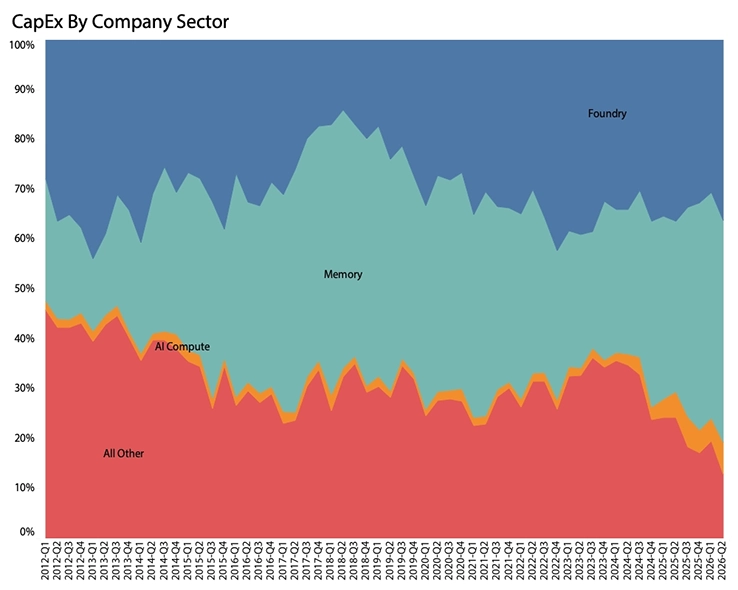
What is interesting is that despite alleged massive investments by memory companies, their share of total CapEx is 45%, well below the 52% they recorded at the peak of the last memory cycle.
Either they are still being "disciplined” with their CapEx investments, or they have not yet reached the tooling phase of the fab construction schedule. No doubt the memory companies are enjoying their scarcity-driven pricing leverage at the moment.
Also, here the other semiconductor companies are in deficit, with only 13% of the investments.
Semiconductor Markets
It is already established by popular agreement that the data centre is driving the current market. Fortunately, this is also what the data shows, so I will avoid getting into trouble this time around.
What used to be well-balanced product categories a decade ago, with consumer (I categorise mobile as a consumer product) and computing as the largest categories at 34% and 40% share, have now become a compute market.
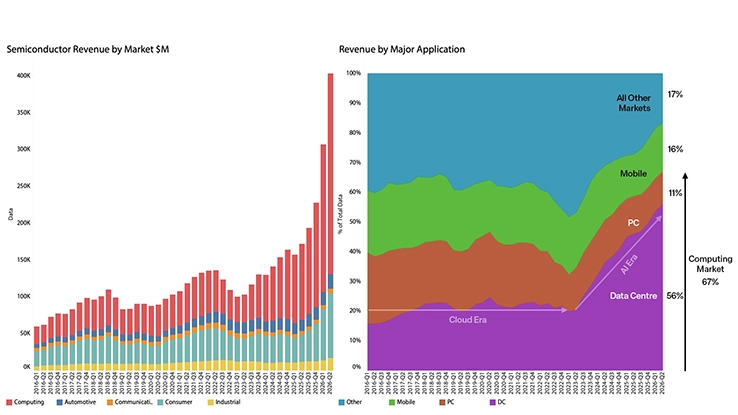
The right-hand graph shows the same market view by major application, with the compute market at two-thirds and the datacenter revenue share at 56%.
While there have been other strong product demand cycles before this one, the almost 3x increase in share in less than three years is unprecedented.
This once again demonstrates how the broader semiconductor industry is being forced into a corner while large companies dominate the arena.
Not only is this a problem for the companies themselves and their 650.000 employees, but it will also disrupt the supply chain and could have a larger impact on society.
Many of these “other” companies with “other” devices provide applications that are important to our health, safety, security, nutrition, occupation, mobility, and general wellbeing, yet they are not prioritised in the current market transformation.
As semiconductor growth has been dominated by the profits of a few companies, the impact on the supply chain has been minimal, but that is about to change.
Supply Chain Analysis
The semiconductor supply network is complex, and companies often participate in more than one market. While I know I can confuse my audience with complexity, I am also very capable of confusing myself, which is much worse.
I generally use colour codes to help me manage complexity and will do so in the following analysis.
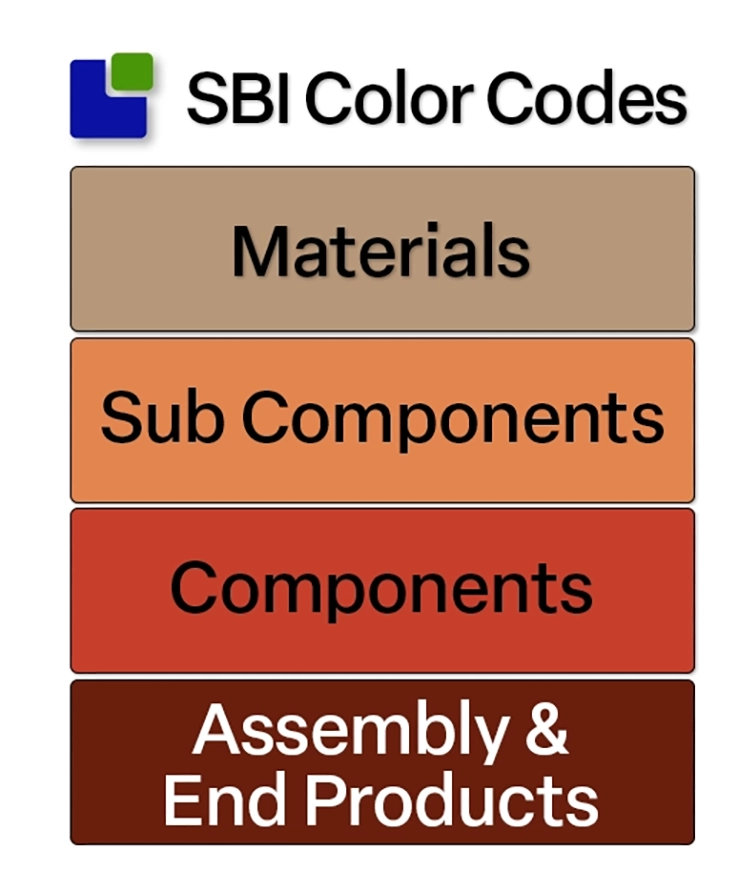
The semiconductor market in its purest form is a device market, although most of Nvidia’s revenue comes from fully assembled servers. In this analysis, I use the “general” practice of categorising this as device revenue, but I can also treat it as server/chip revenue when more useful.
While PCB and PCB materials are not directly part of the Semiconductor supply chain, they are a parallel branch of the larger semiconductor supply network and will be included.
Passive, electromechanical, and Connectors are grouped under the PEMCO header.
The supply network revenue matrix is shown below:
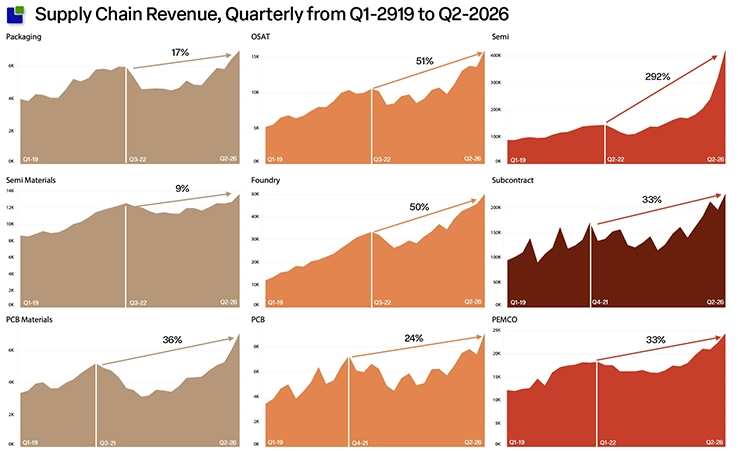
This chart clearly demonstrates the pricing power waterfall from semiconductor devices at the top to the rest of the supply network below. The value and growth are trapped at the top.
While the foundries benefit from participation in the Compute AI growth, they are structurally excluded from the memory boom, as the memory companies have their own manufacturing, with HBM base dies excluded.
It can also be seen that value is now creeping into the OSAT layer but is not yet fully followed by the packaging materials. In PCB, the opposite is true. The materials are capturing more value than the PCB manufacturing itself.
These growth signals are closely associated with pricing power and potential shortages, and should be monitored by purchasing teams.
From a cycle perspective, the Subcontract, PCB, and PCB Materials peaks predate the direct semiconductor supply chain peak by a couple of quarters.
In other words, the last dip was clearly demand-driven rather than due to overcapacity-driven price declines.
While we have yet to determine whether the semiconductor cycle still exists, the signal will likely come from the subcontracting market and the supply chain.
The relative growth from the beginning of 2019 shows the changes in the semiconductor supply network over time.
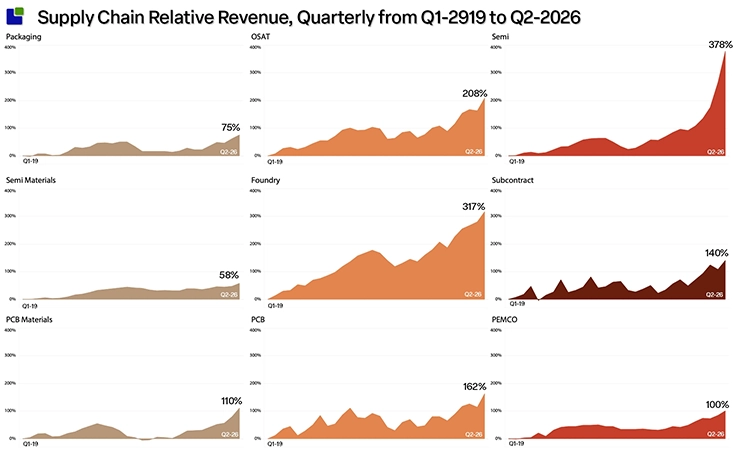
While most sectors responded similarly to the Covid/Chip shortage cycle in 2020-22, some areas show structural changes. While the current AI/Memory boom in the semiconductor sector is event-driven for now, the foundry growth is structural even if driven by a single company.
The switch from noise to signal can also be seen in PCB material and OSAT.
It is clear that most of the supply chain is now operating at a higher revenue level than in the earlier AI Compute and AI Memory eras, and it is necessary to determine whether inventory shortfalls could cause immediate pain for semiconductor companies.
Inventory Structure and levels
While I monitor absolute inventory levels, they are really meaningless unless seen in the context of the business activity levels. Days of inventory is a much more important metric that can reveal both structural and immediate changes in business.
When viewed as a sector overview, the number is not impacted by individual changes in market shares.
In the following chart, the days of inventory by sector is on the same axis scale:
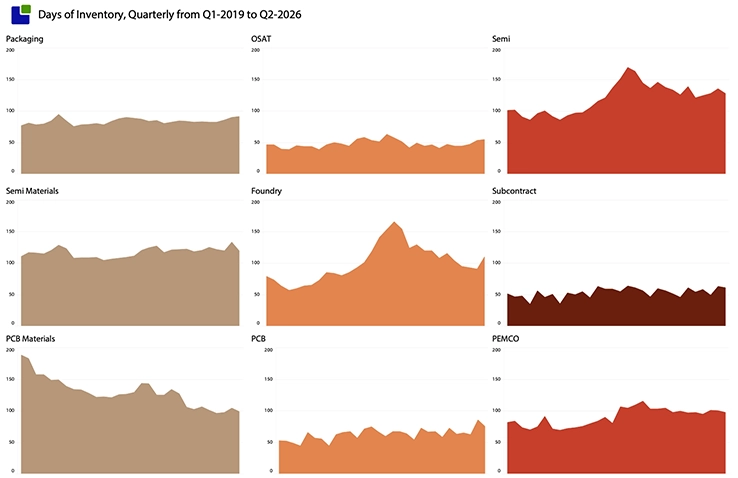
While most sectors remain stable over time, a couple of outliers stand out. The Covid/Shortage cycle is very visible, along with the overshoot result. The same is evident in the foundry inventory, which also shows a pronounced spike in Q2-26.
The other structural change is the decline in PCB materials that requires further examination.
More detail can be uncovered by examining the structure of the inventory as seen below:
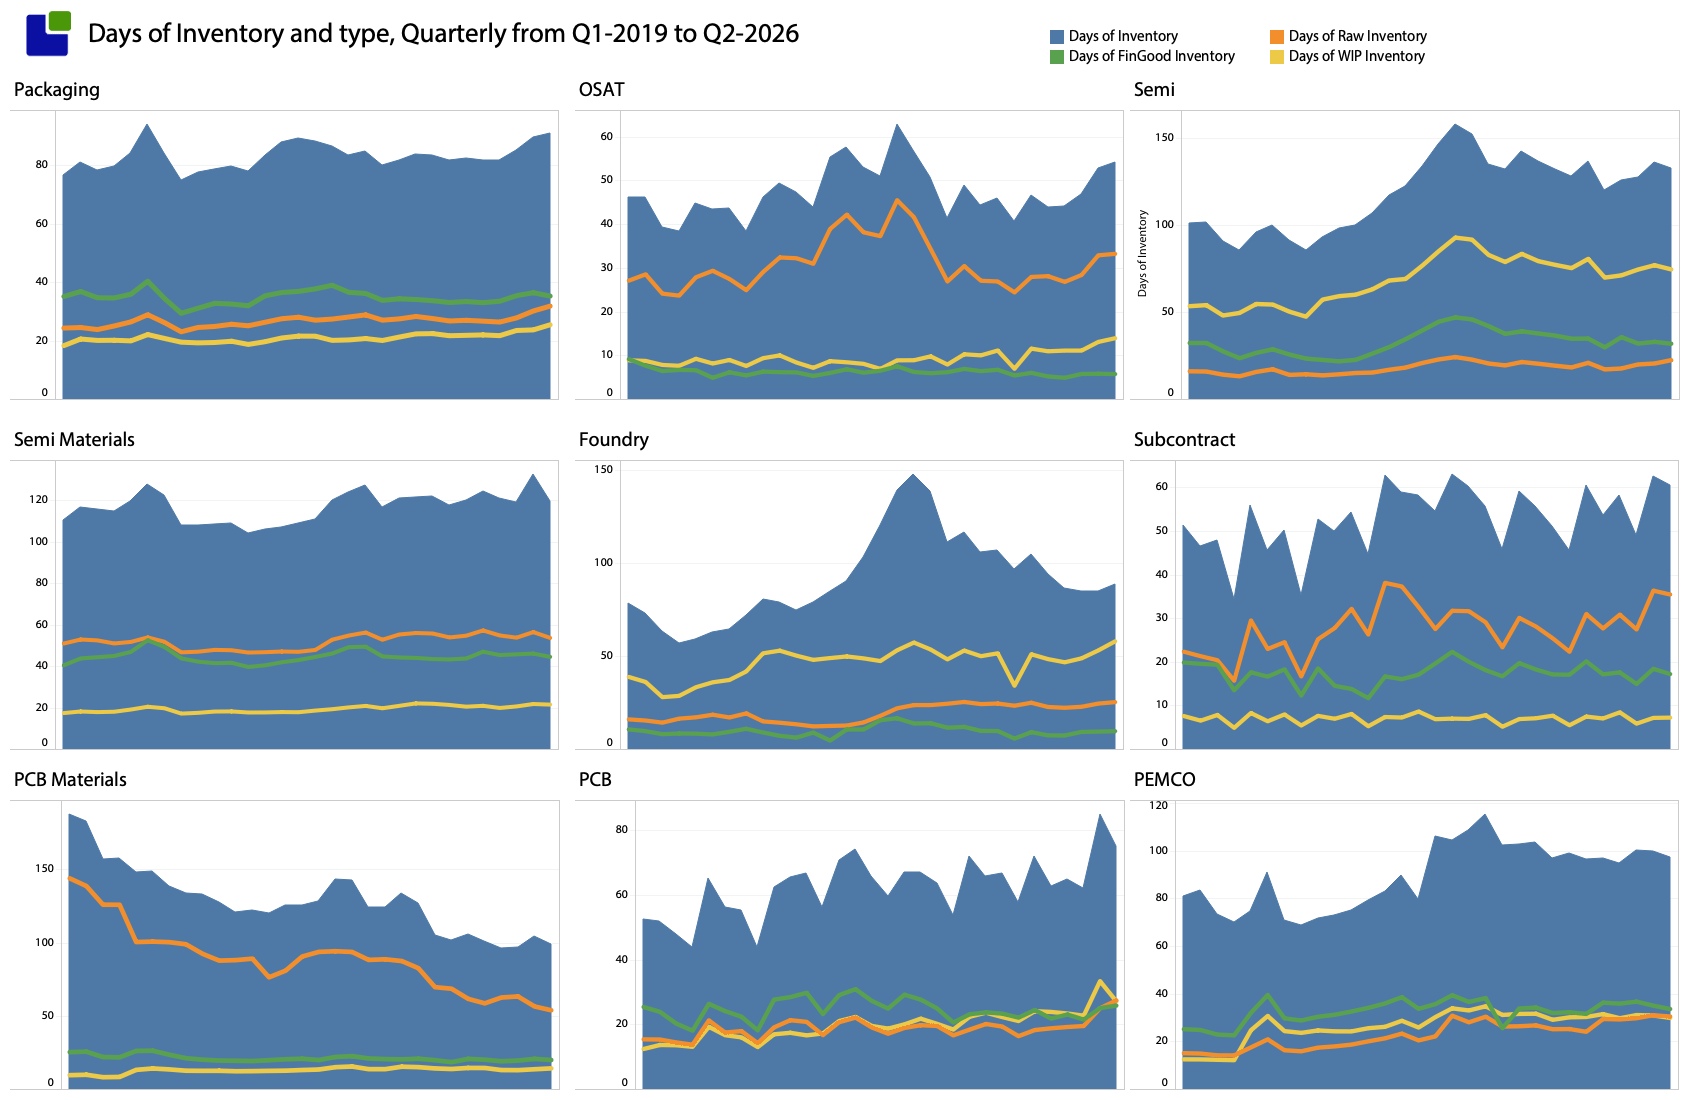
The inventory type shows that while the PCB material decline is certainly structural, it is also solely affecting raw materials inventory. During the earlier shortages of materials for Copper Clad Laminate, Resins, and Glass Cloth, PCB material companies acted as shock absorbers in the PCB supply chain, but as the quality and complexity of PCB materials have increased, the basic materials have become harder to obtain in sufficient quantities. The 98-day raw materials inventory could pose a problem even though the PCB manufacturers themselves have increased their raw materials inventory in response.
The Semiconductor materials and packaging inventories are in good shape but should also be seen in the light of low growth. Should activity pick up as the revenue charts suggest, the steady-as-she-goes inventories might not be sufficient.
Despite semiconductor inventories trending down over the year, things could soon become very interesting. Raw material inventories are rising as prices increase, and critical products are being secured more frequently. Memory might also be impacted slightly, although they do not stay in inventory for many seconds, if at all.
The declining WIP inventory indicates that the die banks are still being depleted for non-AI semiconductor products, with no evidence of a general increase in production. The finished goods inventories have now trended down for three years, reflecting the massive oversupply in the last cycle.
It is already well known that several specialised areas of the AI supply chain are in short supply, but apart from that, the overall supply chain inventory is in good shape, with a few exceptions.
What is more worrying are the investment choices in the different sectors.
The Investment Grid below shows R&D and CapEx spend as a percentage of revenue by sector and quarter. While each sector requires quite different levels of investment, the time trail (8 quarters) of each sector tells a story about what is going on.
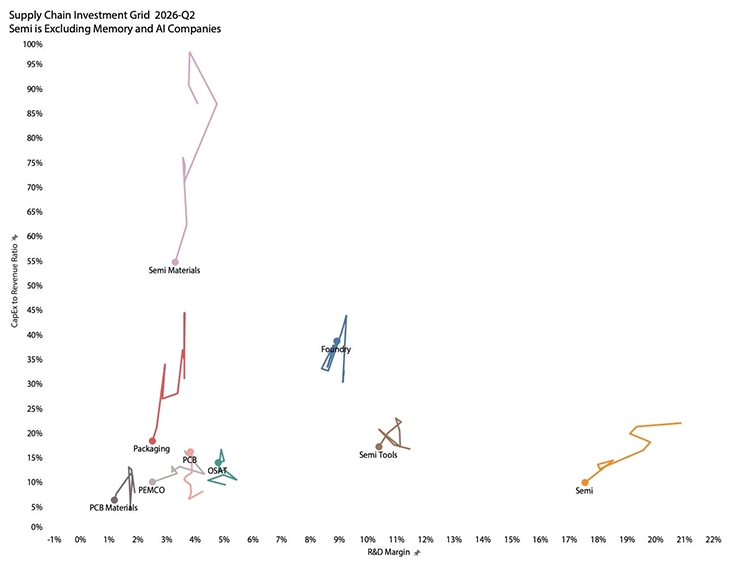
Circling around a sweet spot, the Foundry and OSAT companies are adjusting their investments to their revenues in a fixed operating model. The PCB companies have been in CapEx-investment mode while keeping the R&D margin fixed at 4%.
I have excluded memory and AI companies from the semiconductor plot to make it meaningful, and even so, the revenue growth makes relative investments go south.
The most interesting observation is the CapEx story in the three basic material categories. From what were certainly unrealistic CapEx levels given the revenue and limited growth, the slide has continued, with dips in the last quarter as well.
Like the memory companies, the materials companies are entering a “disciplined investment mode” and are not afraid of creating a little scarcity. This can have a significant impact on the semiconductor industry, as revenue growth is now beginning to propagate throughout the supply chain.
The demand situation
While the prior part of the analysis focused on the structural developments in the semiconductor industry and its supply chain, it is now time to look at the most recent developments in the Q2-2026 reporting, including the demand side of the equation.
The chart below shows the flow of products in the supply chain and the change in revenue from last quarter.
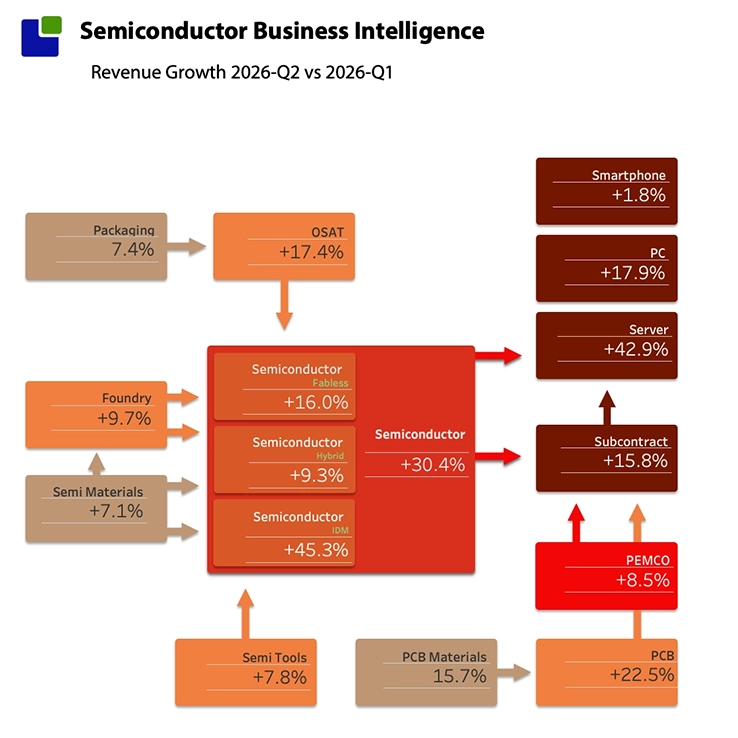
The strong revenue growth of semiconductor device companies is evident in detail, and, to no one’s surprise, it is driven by memory companies among the Integrated Device Manufacturers. The best guess is that the shortage will last until 2028 unless demand collapses; even then, long-term contracts will keep memory companies afloat.
The HBM strategy is designed to capture more DRAM and NAND capacity for every future generation, which makes things even worse.
The materials revenue growth is strong, seen in light of the historically weak growth over this decade. The combination of lower investment levels and higher revenue growth is likely to negatively impact material customers.
At the device level, OSAT and PCB are now exhibiting strong growth not seen for some time. While PCB companies are increasing investment, OSAT companies are investing at the rate of revenue growth.
On the demand side, the subcontract market is growing, driven by red-hot demand for servers. The smartphone market has stalled while the PC market is surprisingly resilient. Even though all the growth is driven by higher memory prices, it is still impressive that sales are not being killed by current memory prices (yet?).
The plot of input costs, as reflected in Cost of Goods Sold growth, confirms this.
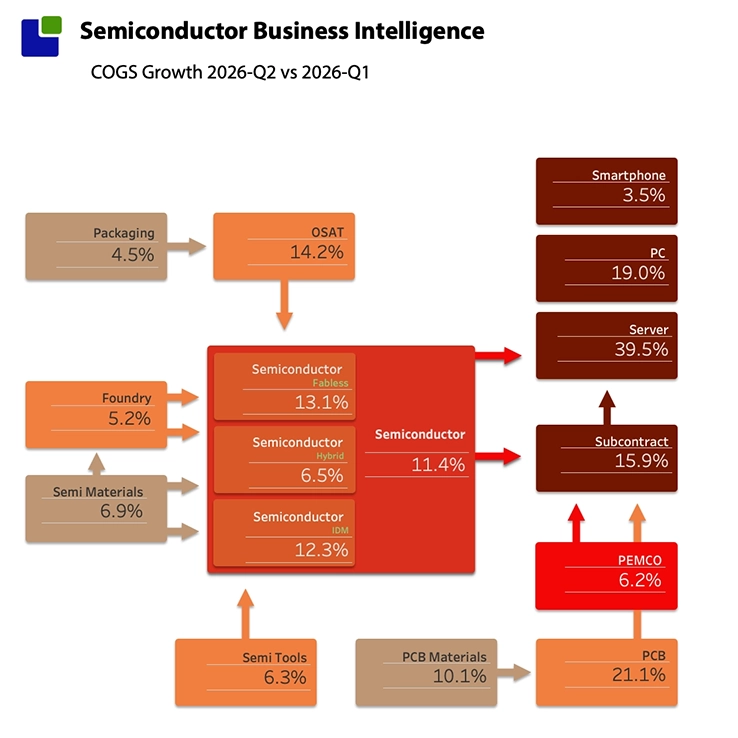
This also shows the dramatic increase in value in the semiconductor sector, particularly for memory IDMs. It can also be seen that most growth in the other sectors is similar to their revenue growth, suggesting cost pass-through rather than organic growth.
While the supply chain has been able to handle the increase in Cost of Goods Sold up to now, COGS growth this quarter alone is at twice last year's rate.
Conclusion
We are not three-quarters of the way into the AI Memory Era, with no end in sight. Despite potential AI model slowdowns, memory companies have secured long-term orders and price agreements, and Nvidia’s business remains strong, while Broadcom/Google/Antropic has unveiled significant investment plans. The Semiconductor story now has only one chapter. The AI data centre buildout now accounts for more than 56% of semiconductor sales.
The short sellers are running out of shorts as their story remains true and unproductive. The entire AI revolution rests on the successful development of more productive AI, enabled by increased compute. If that changes, everything changes.
As the AI revolution has largely expanded semiconductor margins, the semiconductor supply chain has not been invited to the party, and its revenue has grown only modestly. While the device sector has been growing for some time, the materials markets are waking up from a long hibernation.
The value in the semiconductor supply network is still trapped at the top, but the device sectors are now participating.
Except for PCB materials, the inventory situation remains reasonable, with pockets of issues related to the AI supply chain.
As we move into a higher-growth period, the more worrying development is the lower CapEx from materials companies. This looks very similar to the development in the memory markets, where terms like “disciplined CapEx spend” were code for creating pricing power in shortage markets.
While material companies will not be as successful as memory companies at capturing value, there could be pain on the horizon for material customers, and there is not much room for expansion in materials.
The demand side of the Semiconductor supply network is also a story of the AI data centre, but most of the increase in demand revenue is based on cost increases carried forward.
There is a limit to how much pain the PC and Smartphones can take, but their shares of the total market are diminishing every quarter. From 45% a decade ago, PCs and Smartphones now account for 27% of the market.
While many areas of the supply network appear balanced, investments remain weak, leaving little room for the expansion now underway.
That is, if the AI revolution continues. A potential oil shock could disrupt the entire supply network and significantly impact demand.
Semiconductor fabs don’t run on oil, but several materials used in manufacturing come from petrochemical production, and an oil shortage can lead to scarcity of certain semiconductor materials.
But more importantly, an oil shock could collapse demand, popping the current profit bubble. This would not lower supply much, since semiconductor growth is primarily profit-driven, as shown below.
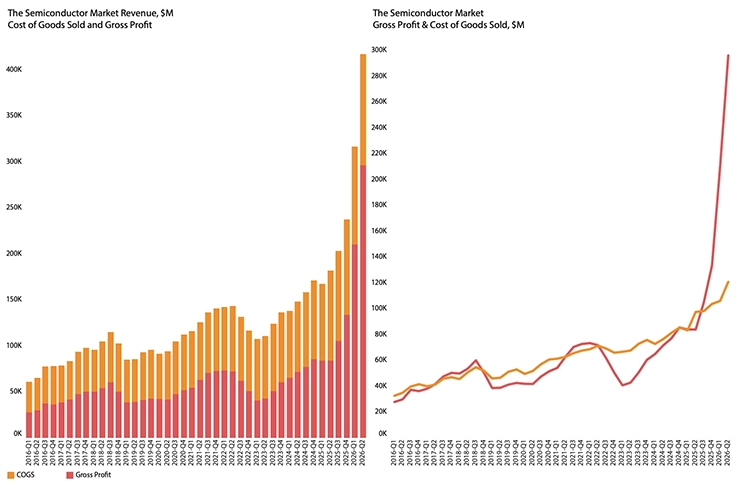
Since the last Semiconductor cycle peak 4 years ago, Gross Profit has grown 4.2x while COGS has grown 50%, and almost a quarter of that growth came from this quarter alone.
What is certain is that uncertainty is at an all-time high in the semiconductor industry, and caution is needed.