


DRAM industry revenue surges 59.5% in Q2 as supply lags demand
Total DRAM industry revenue rose 59.5% QoQ in Q2 2026, reaching nearly USD 154.73 billion, driven by sharp increases in contract prices and sustained AI server demand. Supply expansion continues to lag demand growth, with supplier inventories at historic lows, according to TrendForce.
Growing demand for AI servers – fuelled by LLM training, AI inference and the expansion of agentic AI applications – drove higher shipments of HBM3e, LPDDR5X and high-capacity RDIMMs. On the supply side, additional capacity has been primarily allocated for server use, meaning DRAM bit shipments grew only modestly in the quarter, according to a press release from TrendForce.
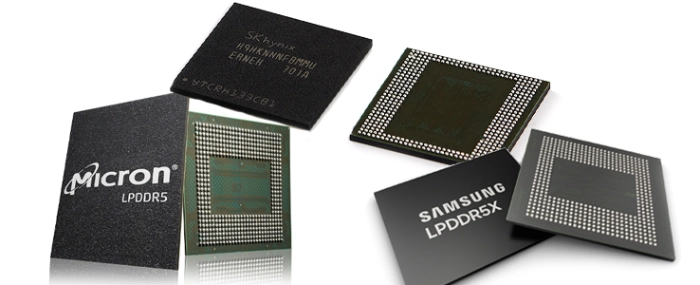
Samsung posted the strongest quarter-on-quarter bit shipment growth among the three major suppliers, supported by an early move into HBM4 mass production. Combined with a substantial increase in average selling prices, Samsung's Q2 revenue reached USD 60.98 billion, up 63.4%, giving the company a market share of 39.4%.
SK Hynix ranked second with revenue of USD 38.59 billion, up 37.9%. HBM accounted for the highest proportion of its bit shipments among the top three suppliers, which limited ASP growth. Market share edged down to 24.9%. Micron continued to prioritise higher-priced server DRAM, with revenue rising 65.5% to USD 36.0 billion and market share increasing slightly to 23.3%.
Among smaller suppliers, significant increases in DDR4 and DDR3 contract prices drove strong growth for Nanya, up 68.3% to USD 2.61 billion, and Winbond, up 75.8% to USD 998 million. These suppliers are benefiting from demand the major suppliers can no longer fully serve as they migrate to more advanced processes.
Looking ahead, TrendForce expects conventional DRAM contract price growth to moderate to 13–18% QoQ in Q3.
| Rank | Company | Revenue (USD million) | Market share | |||
| 2Q26 | 1Q26 | QoQ | 2Q26 | 1Q26 | ||
| 1 | Samsung | 60,981 | 37,323 | 63.4% | 39.4% | 38.5% |
| 2 | SK hynix | 38,590 | 27,982 | 37.9% | 24.9% | 28.8% |
| 3 | Micron | 36,000 | 21,750 | 65.5% | 23.3% | 22.4% |
| 4 | CXMT | 14,624 | 7,339 | 99.3% | 9.5% | 7.6% |
| 5 | Nanya | 2,612 | 1,552 | 68.3% | 1.7% | 1.6% |
| 6 | Winbond | 998 | 568 | 75.8% | 0.6% | 0.6% |
| 7 | PSMC | 115 | 43 | 167.8% | 0.07% | 0.04% |
| Others | 808 | 444 | 82.0% | 0.5% | 0.5% | |
| Total | 154,726 | 97,000 | 59.5% | 100% | 100% | |