Semi industry capex forecasted to reach over $190B this year
2020-2022 is expected to become the first three year period of double-digit capex growth since 1993-1995.
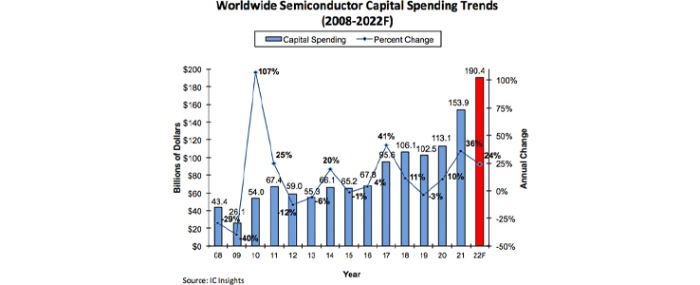
Figure 1 shows that after surging 36% in 2021, semiconductor industry capital spending is forecast to jump 24% in 2022 to a new all-time high of USD 190.4 billion, up 86% from just three years earlier in 2019. Moreover, if capital spending increases by ≥10% in 2022, it would mark the first three-year period of double-digit spending increases in the semiconductor industry since the 1993-1995 timeperiod.
With many supply chains strained or broken during the pandemic, the electronics industry, in many cases, was left unprepared for the current rebound in demand. Booming demand has pushed most fabrication facility utilisation rates well above 90% with many of the semiconductor foundries operating at 100% utilisation. With such strong utilisation rates and the expectations of continued high demand, the combined semiconductor industry capital spending in 2021 and 2022 is forecast to reach USD 344.3 billion.
The table below shows a sampling of 13 companies that are expected to increase their capital outlays by ≥40% this year. In total, these 13 companies spent USD 60.6 billion last year, which was up 62% from 2020, and are forecast to spend USD 91.8 billion this year, up 52% from 2021. It is interesting to note that the big three memory suppliers (i.e., Samsung, SK Hynix, and Micron) are not on the list while the top three pure-play foundries (TSMC, UMC, and GlobalFoundries) are included. Moreover, illustrating the diversity of the listing, four of the top five leading analog IC suppliers (Texas Instruments, Analog Devices, Infineon, and STMicroelectronics) are scheduled to significantly ramp up spending in 2022.
The combined outlays of the 13 companies shown in the table are expected to be almost 2.5x what they were two years earlier in 2020. However, the majority of these semiconductor manufacturers are responding to the current demand surge. Over the next few years, many companies’ outlays are likely to revert to a capital spending as a percent of sales ratio of somewhere near pre-pandemic levels.
| 2022F Rank | Company | HQ | 2019 ($M) | 2020 ($M) | 20/19 % Change | 2021 ($M) | 21/20 % Change | 2022F ($M) | 22/21 % Change |
| 1 | Winbond | Taiwan | 433 | 284 | -34% | 352 | 24% | 1,645 | 367% |
| 2 | GlobalFoundries | USA | 773 | 592 | -23% | 1,766 | 198% | 4,500 | 155% |
| 3 | Nanya | Taiwan | 178 | 291 | 63% | 404 | 39% | 1,000 | 148% |
| 4 | Renesas | Japan | 351 | 209 | -40% | 333 | 59% | 800 | 140% |
| 5 | Analog Devices | USA | 251 | 174 | -31% | 372 | 114% | 800 | 115% |
| 6 | ONsemi | USA | 535 | 384 | -28% | 445 | 16% | 935 | 110% |
| 7 | ST | Europe | 1,174 | 1,278 | 9% | 1,828 | 43% | 3,500 | 71% |
| 8 | Vanguard | Taiwan | 279 | 128 | -54% | 477 | 273% | 865 | 81% |
| 9 | UMC | Taiwan | 566 | 952 | 68% | 1,755 | 84% | 3,000 | 71% |
| 10 | Intel | USA | 16,213 | 14,259 | -12% | 18,733 | 31% | 27,000 | 44% |
| 11 | TI | USA | 847 | 649 | -23% | 2,462 | 279% | 3,500 | 42% |
| 12 | Infineon | Europe | 1,279 | 1,067 | -17% | 1,637 | 53% | 2,300 | 41% |
| 13 | TSMC | Taiwan | 14,937 | 17.240 | -15% | 30,043 | 74% | 42,000 | 40% |
| – | Total | – | 37,816 | 37,507 | -1% | 60,607 | 62% | 91,845 | 52% |