



EMS under the hood: Dissecting the financial engines of Europe’s manufacturing leaders
EMS companies have been recently publishing mainly positive headlines related to growth and improving profitability. Even the most struggling companies, Lacroix and TT Electronics, are indicating a comeback after serious restructuring in the Americas region. This is very welcome news for the industry after all the recent crises impacting demand and supply chain.
Author: Riku Hynninen - CEO & Founder - Agame Oy
In Europe, the defence & aerospace is currently the main growth driver, while among the EMS giants, the AI-related data centre growth plays a pivotal role.
I spent some time analysing the annual reports of 10 European publicly reporting companies, in order to understand how the engines of these companies are doing. The questions I wanted to understand better are:
- What is the profitability from the owner's perspective? In part 1, I highlight some interesting differences in depreciation, amortisation, interest and tax rates, which lead to a strong EBITDA diluting to an average or subpar Net Profit
- In part 2, following the acquisition spree of 2025, which companies still have the most firepower in their balance sheet to continue with the industry consolidation, and which companies would have to consider raising new capital?
- In part 3, I will look into the capital efficiency: in the manufacturing industry, net working capital may vary significantly and pose a short-term liquidity risk for companies that hit difficult supply chain conditions under stretched leverage. How do the companies differ in terms of capital structure? Which companies have the best Return on Equity, and does that correlate with Gearing?
Part 1: Who are the actual owners’ favourites behind EBITDA and EBIT?
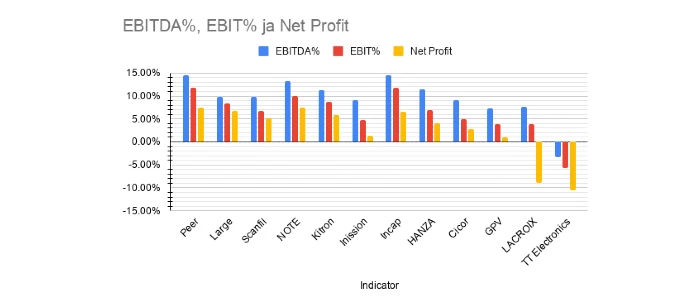
NOTE is the European profitability leader, while Celestica is the benchmark among giant EMSs
A general impression has been that Incap is the most profitable company in the pack, thanks to its reported extraordinarily high EBITDA and operating margin. However, the comparison shows that the actual profitability leader in 2025 was NOTE with its Net Profit % of 7.4 %.
Incap (6.5 %), Kitron (5.9%) and Scanfil (5.1%) generated net profit above 5%, and Hanza still a decent 4.1%. The rest of the European companies in comparison were scrambling between -10.5% and +2.8%.
As a reference, the net profit % of giant EMS companies (Hon Hai, Sanmina, Jabil, Flex) hovered around 2.2% - 3.3%, with Celestica as an outlier. Celestica achieved a net profit of 6.7 % with its phenomenal success in the AI infrastructure business. It is also worth noting that about 1 percentage point of Celestica’s extraordinary result is contributed by accounting gains from total return swap and tax credit release. Excluding that is still resulting in quite a juicy adjusted net profit of 5.7%, clearly beating its giant peers.
TIDA% bridge: Where profits go to hide
Figure 2 shows significantly varying gaps between Net Profit and reported EBITDA. First, let’s single out Lacroix, whose big percentage of “IT% = interests and taxes” is resulting from massive write-offs of its discontinued North American business. Among the rest, Companies with the highest “TIDA%” are Incap, TT Electronics (both 8.8 %), Inission (7.8 %) and Hanza (7.4 %). Let’s look at each of these companies to understand what is behind.
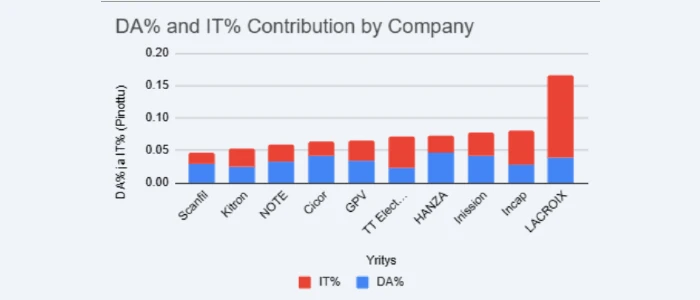
Figure 2. Bridge from EBITDA to Net Profit: Depreciations, amortisations, interest and taxes. © Agame Oy
Incap: The tax trap
Incap ended up paying EUR 8.3 million taxes out of EUR 22.3 million profit before tax, which is 37% and contributes to almost 4% of revenue. This is extraordinarily high compared to the previous year of 24 %, which is a normal level among its peers.
India is currently Incap’s biggest operational region in terms of revenue and profit. Getting the generated revenue out of the country for growth investments outside of India, or eventual dividends to shareholders, may continue to push the tax rate up, also in the future.
TT Electronics: Characterised by company restructuring
The TT Electronics case should be looked at in the light of a wider restructuring context. The company closed its factory in Plano and took restructuring actions in their Cleveland site. Figure 2 illustrates the bridge in the continuing business only after closing their Plano operations.
In the statutory reporting, their total profit impact related to restructuring was reported at negative GBP 65.4 million (13.6% of revenue). The biggest items are related to asset impairments, measurement losses (GBP -41.4 million), and restructuring costs (GBP -15.2 million). On the taxation side, TT Electronics reported a loss of accumulated tax credits in the exited Plano operation, leading to an unusually high effective tax rate of 38 % (GBP -13.9 million).
Based on their adjusted operating profit of 37.2 MGBP (7.7 % of revenue) and improving balance sheet, we may expect to see a healthy comeback in 2026!
Inission: high depreciation and tax rate
Inission tax rate was extraordinarily high in 2025, at ~39%. This was driven by M&A fees that were not tax deductible, subsidiary losses without tax benefit and revaluations of deferred tax assets. This can be considered a non-recurring impact specific for 2025.
Inission's D&A represent 4.3% of revenue vs peer group average of 3.6%. One reason could be that Inission's factory footprint is quite fragmented. Second, most of their property, plant & equipment are leased. This may somewhat inflate the Right-of-Use asset depreciations compared with depreciating own assets.
Hanza: Bold growth by acquisitions and capacity expansions
Hanza’s D&A % is the highest among peers (4.6 %) while its tax rate is among the lowest. Higher leverage compared with peers is reflected in their financing costs that are >2% of revenue. Altogether, the TIDA% bridge from EBITDA to Net Profit is 7.4%. Not only did Hanza increase its leverage (Orbit One acquisition), but it also issued new shares to finance its Leden acquisition. A significant share issue for the BMK acquisition was announced late 2025 and issued early 2026.
Hanza acquired and expanded its asset base throughout 2024 and 2025: Acquisitions of Orbit One and Leden, a new factory lease in Finland, factory expansion in Sweden, and capacity & automation investments in production equipment drove up its D&A from SEK 203 million to SEK 277 million.
The capacity expansions made in 2025 can be expected to become efficiently utilised, and the acquired BMK will generate significantly more business in 2026. As a result, the top line will grow, which will eventually decrease the TIDA% of revenue.
Non-cash items leaders, Scanfil and Kitron
Scanfil (4.6 %) and Kitron (5.3 %) are standing out with their lean expenses and non-cash items below EBITDA. Further, their effective tax rates are among the lowest in the peer group. Especially, Scanfil’s financial items are very low thanks to its low leverage.
Profit is the engine’s output, but to win the long-distance race of industry consolidation, you need more than just a high-revving engine – you need a full tank of gas. In Part 2, we will be looking at the 'M&A Firepower' left in these balance sheets to see who is ready to buy their way to the front of the pack.
During Evertiq Expo Warsaw on October 22, 2026, Riku Hynninen will take the stage to present a financial benchmarking analysis of 10 leading European EMS companies. His presentation will explore how profitability is shaped by factors such as depreciation, interest and taxation, while also identifying which companies are best positioned for future M&A activity following recent industry consolidation.